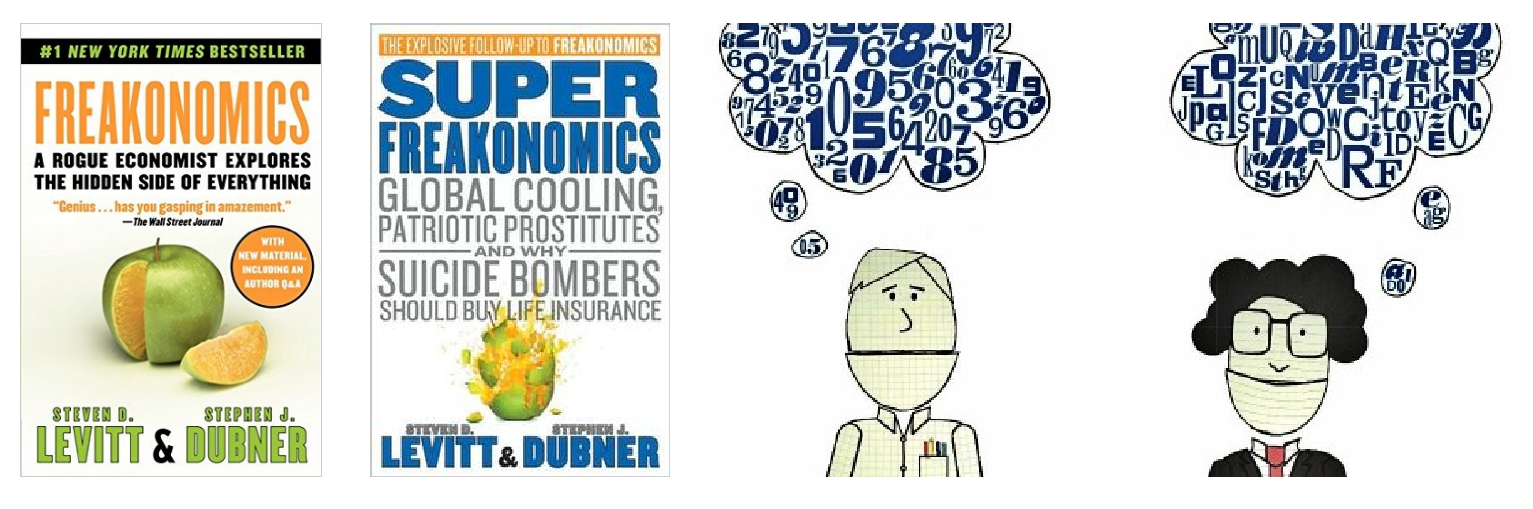
Freakonomics: A Rogue Economist Explores the Hidden Side of Everything by Steven Levitt (Univ. of Chicago) & Stephen J. Dubner (New York Times).
A blog on freakonometrics ? (now called data science)
 freakonometrics.hypotheses.org
 freakonometrics
Data
"People use statistics as the drunken man uses lamp posts - for support rather than illumination" Andrew Lang (or not)

Economics
Economics focuses on the behavior and interactions of economic agents and how economies work.
Economics & Algorithms

See Eisen (2011) Amazon's $23,698,655.93 book about flies
Economics & Algorithms (HFT)
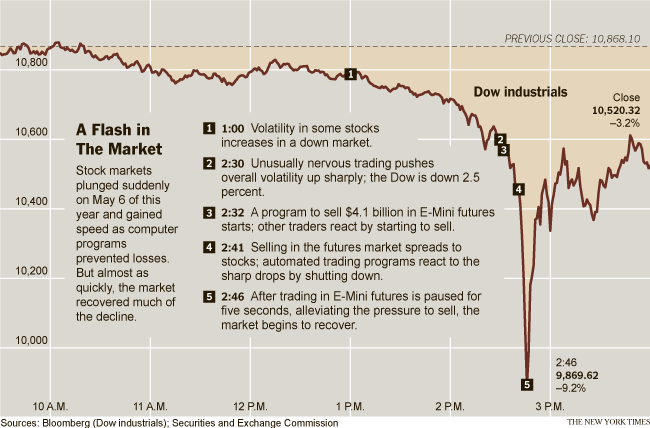
See Wikipedia 2010 Flash Crash.
Computational Economics
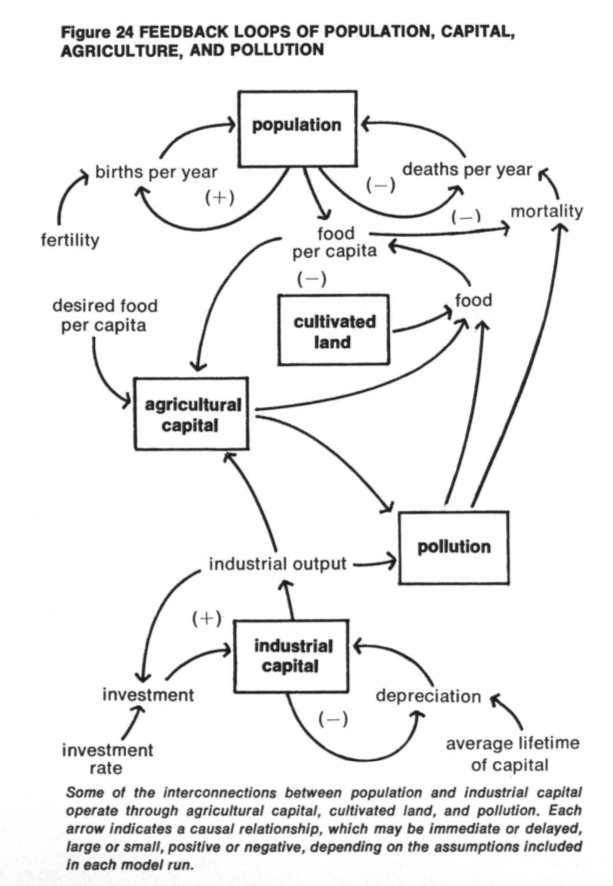
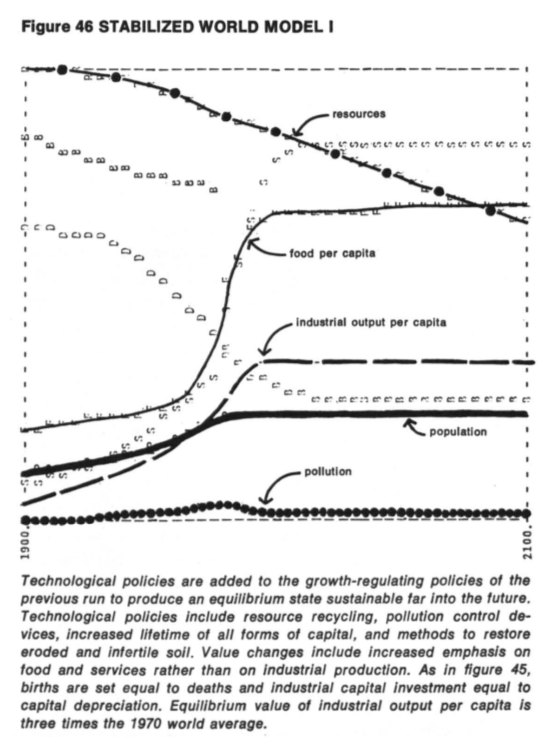
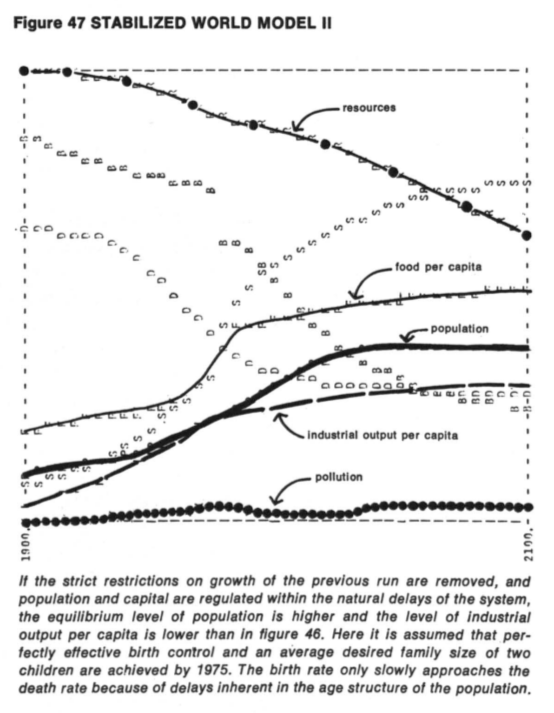
Equilibrium of 'complex' dynamic systems, see Meadows et al. (1972) The Limits of Growth and Sargent & Stachurski (2015) on Quantitative Economics with Python
Econometrics: Economics & Data
"Econometrics is seens a vehicle for fundamental innovations in scientific method, above all, in the development of operative forecasting procedures in non-experimental situations"", see Wold (1969) Econometrics as Pioneering in Nonexperimental Model Building
Historically, econometric models were designed for macroeconomic data
Econometrics: Economics & Data
Nowadays, more and more econometric models designed for microeconomic data
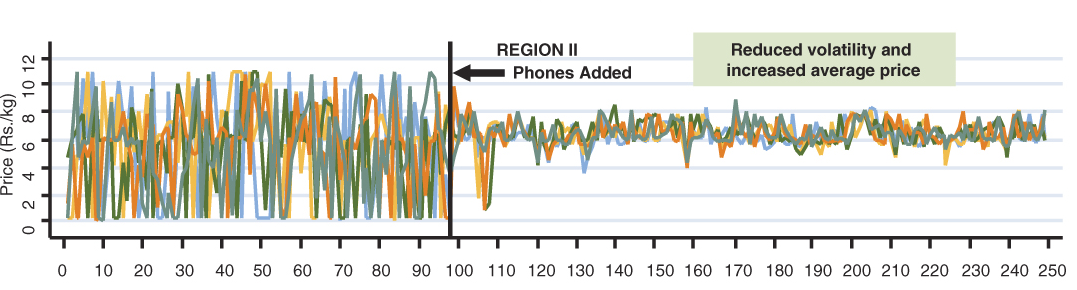
See Jensen (2007) The Digital Provide: Information, Market Performance, and Welfare in the South Indian Fisheries Sector
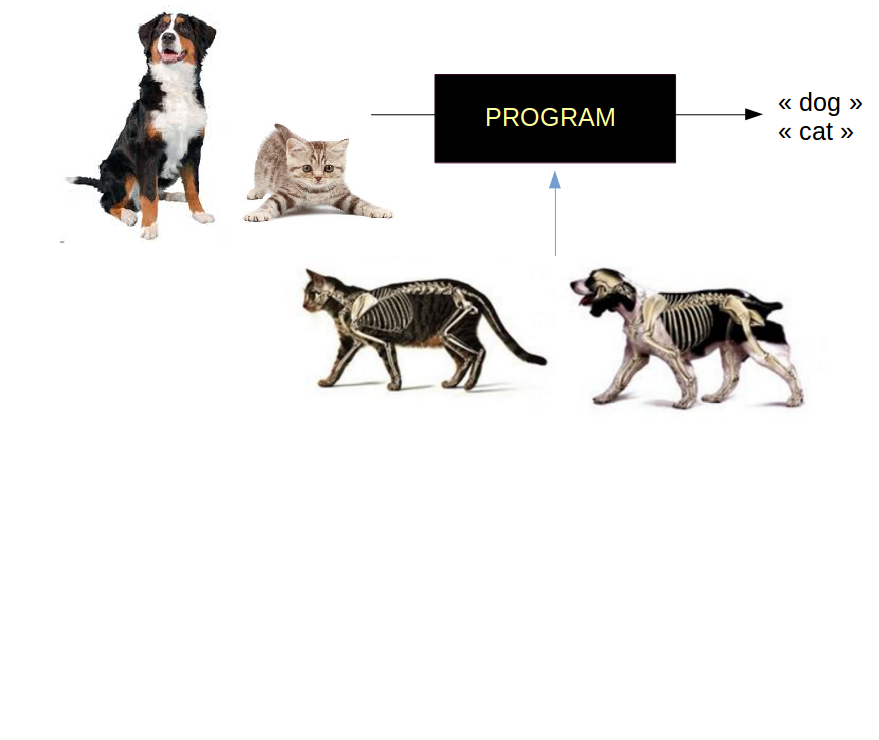
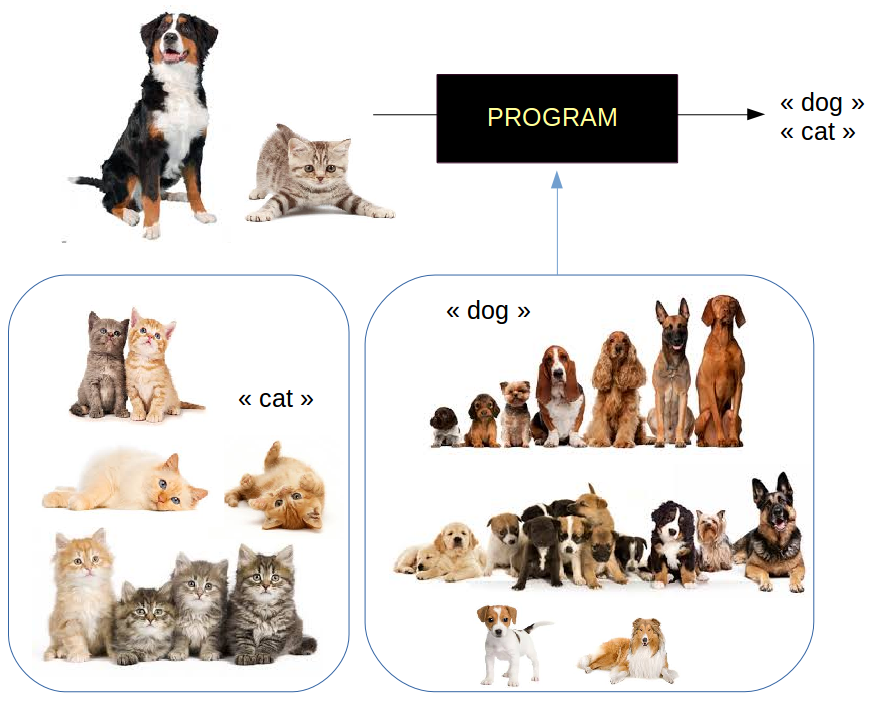
Econometrics vs. Machine Learning
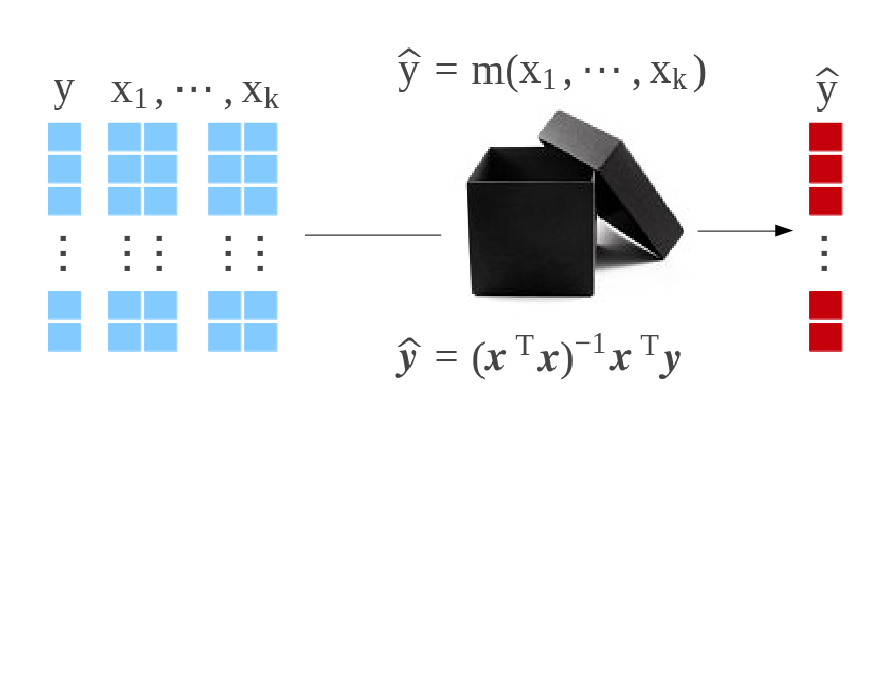
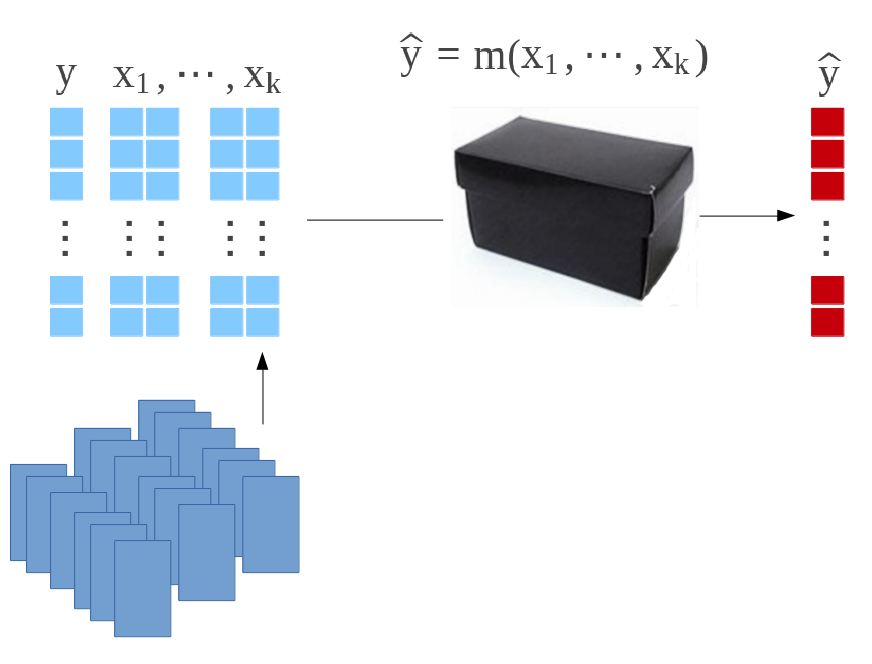
A supervised model for \(y\in R~\) given \(\boldsymbol{x}\in R^k~\) is a mapping \(m:R^k\rightarrow R~\). A dataset is a collection of observations \((\boldsymbol{x}_i,y_i)~\), where \(i=1,\cdots,n\).
In Econometrics, given some probability space \((\Omega,A,P)\), assume that \(y_i\) are realization of i.i.d. variables \(Y_i\) (given \(\boldsymbol{X}_i=\boldsymbol{x}_i\)) with distribution \(F_i\). Then solve \[ \widehat{m}(\cdot)=\underset{m(\cdot)\in F}{\text{argmax}}\left\lbrace \log\mathcal{L}(m(\boldsymbol{x});\boldsymbol{y}) \right\rbrace = \underset{m(\cdot)\in F}{\text{argmax}}\left\lbrace \sum_{i=1}^n \log f(y_i; m(\boldsymbol{x}_i)) \right\rbrace \] where \(\log\mathcal{L}\) denotes the log-likelihood.
In Machine Learning, given some dataset \((\boldsymbol{x}_i,y_i)\), solve \[ \widehat{m}(\cdot)=\underset{m(\cdot)\in F}{\text{argmin}}\left\lbrace \sum_{i=1}^n \ell(y_i,m(\boldsymbol{x}_i)) \right\rbrace \] for some loss functions \(\ell(\cdot,\cdot)\). See Varian (2015) or Kaldero & Taurasi (2015)
Econometrics vs. Machine Learning
Consider an optimal smoothing problem: optimal \(h\) for \(\widehat{m}_h(\cdot)\)
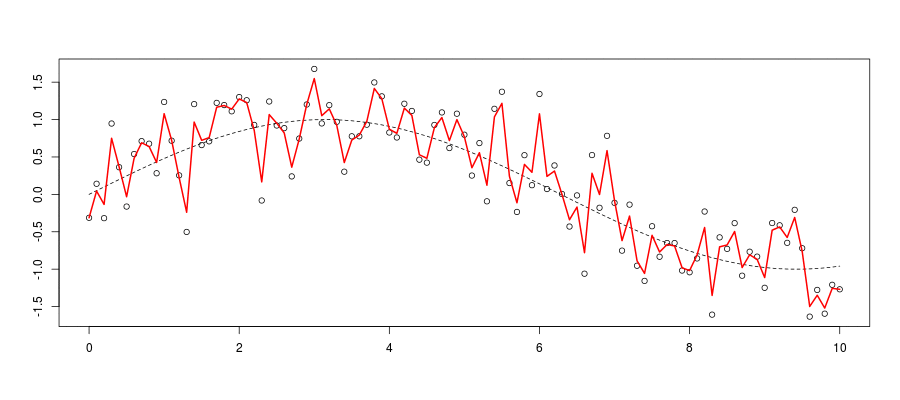
Standard criteria, minimize the mean integrated squared error \(\widehat{m}_{\color{red}{h}}(\cdot)\), \[ mise(\color{red}{h})=\mathbb{E}\left[\int\left( m(\boldsymbol{x})-\widehat{m}_{\color{red}{h}}(\boldsymbol{x}) \right)^2d\boldsymbol{x}\right] \]
Econometrics vs. Machine Learning
In Econometrics, massive use of asymptotic statistical properties, i.e. CLT, \[ \sqrt{\color{blue}{n}}(\overline{X} - \mathbb{E}[X])\ \overset{L}\rightarrow N(0,\;\text{Var}[X]) \] and Taylor expansion (delta method).
For some kernel based smoother, as \(\color{blue}{n}\rightarrow\infty\) \[ mise(\color{red}{h}) \sim \frac{\color{red}{h}^4}{4}\left(\int x^2K(\boldsymbol{x})d\boldsymbol{x} \right)^2\int\left(m''(\boldsymbol{x})+2m'(\boldsymbol{x})\frac{f'(\boldsymbol{x})}{f(\boldsymbol{x})}\right)d\boldsymbol{x} \\ +\frac{1}{\color{blue}{n}\color{red}{h}}\sigma^2\int K^2(\boldsymbol{x})d\boldsymbol{x} \int\frac{d\boldsymbol{x}}{f(\boldsymbol{x})} \] Thus, standard rule of thumb, \(\color{red}{h^\star \sim \color{blue}{n}^{-\frac{1}{5}}}\) (up to some multiplicative constant).
Econometrics vs. Machine Learning
In Machine Learning, use bootstrap / cross validation.
E.g. for leave-on-out cross validation define \[ \widehat{mise}({\color{red}{h}})=\frac{1}{n}\sum [y_i - \widehat{m}_{\color{red}{h},(i)}(\boldsymbol{x}_i)]^2 \] then set \(\color{red}{h^\star}=\text{argmin}\lbrace\widehat{mise}({\color{red}{h}})\rbrace\)
Machine learning methods are about algorithms, more than asymptotic statistical properties.
Economics in 1965-1985
Economics in 2015-
Machine Learning & AI
Machine Learning & AI
Big or Small Data
Big data, scalability issues but good news to test microeconomic models, e.g. oil price, prixdescarburants.info and data.gouv.fr
Small data,
sampling techniques (e.g. selection bias)
aggregation techniques (e.g. ecological fallacy)
Ecological Fallacy
E.g. Simpson's Paradox, Blyth (1972), or Charpentier (2015)
| Hospital | Admission | Survival | Death | Survival Rate |
|---|---|---|---|---|
| A | 1000 | 800 | 200 | 80% |
| B | 1000 | 900 | 100 | 90% |
For healthy people
| Hospital | Admission | Survival | Death | Survival Rate |
|---|---|---|---|---|
| A | 600 | 590 | 10 | 98% |
| B | 900 | 870 | 30 | 97% |
while for sick people
| Hospital | Admission | Survival | Death | Survival Rate |
|---|---|---|---|---|
| A | 400 | 210 | 190 | 53% |
| B | 100 | 30 | 70 | 30% |